| |
| ENVIRONMENT PERFORMANCE |
| EMISSIONS |
|
|
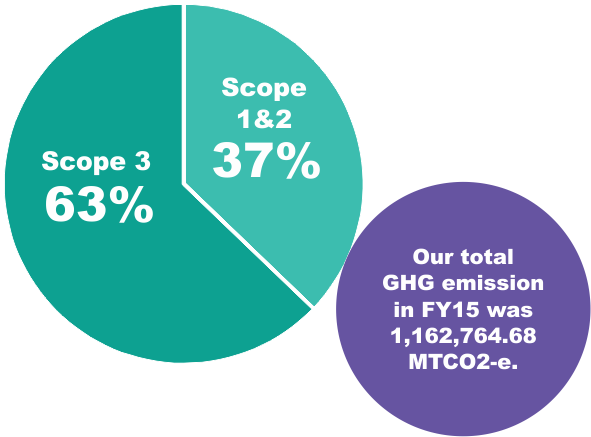
| GHG Footprint Analysis |
| We have set a target to reduce our GHG footprint by 2% and included the same in the corporate scorecard. Towards this objective, this year we conducted a detailed GHG footprint analysis to establish a credible baseline. |
| The sources of carbon emission for our operations are reported under three categories: |
|
|
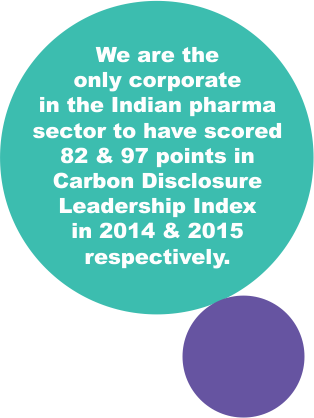
In the reporting period, we had our carbon disclosures independently assessed and ranked against the Carbon Disclosure Project's widely-respected scoring methodology. |
|
|
| Scope 1 |
DIRECT
EMISSIONS |
(under direct operational
control of Dr. Reddy's) |
|
|
|
| Scope 2 |
PURCHASED
ELECTRICITY |
(not under direct operational
control of Dr. Reddy's) |
|
|
|
| Scope 3 |
OTHER INDIRECT
EMISSIONS |
(not under operational
control of Dr. Reddy's) |
|
|
| |
| Dr. Reddy's Scope-1, Scope-2 and Scope-3 GHG Footprint |
| Out of the total emissions, the emissions are highest
for Scope 3. This is because
Dr. Reddy's has a large supply chain & distribution network across India. |
|
|
 |
|
| |
| |
| BU-wise Scope 1 and Scope 2 GHG Footprint |
|
BU-wise Scope 3 GHG Footprint |
|
| CPS | 1% |
| |
| BDC | 4% |
| |
| Corporate | <1% |
| |
| IPDO | 2% |
| |
| FTO | 29% |
| |
| CTO | 64% |
|
|
|
| CPS | <1% |
| |
| BDC | 3% |
| |
| Corporate | <1% |
| |
| IPDO | 1% |
| |
| FTO | 15% |
| |
| CTO | 81% |
|
|
| |
FTO: Formulations manufacturing units
CTO: API manufacturing units
CPS: Custom Pharma Services
BDC: Business Development Centre
IPDO: Integrated Product Development Organisation |
|
| |
| |
| |
| |
| |
| |