| Personnel |
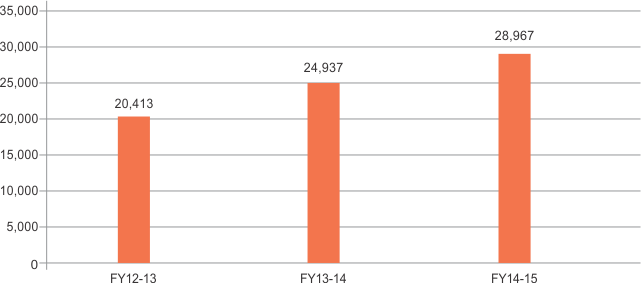
| People are the engines of our business and deserve a fair share of our profits. In the reporting period, an increasing number of employees were roped in at attractive pay packages and performing employees were rewarded with handsome increments. |
|
| |
|
FY12-13 |
|
FY13-14 |
|
FY14-15 |
| Total personnel cost (Including R&D) |
|
20,413 |
|
24,937 |
|
28,967 |
| % of sales |
|
17.55 |
|
18.67 |
|
19.55 |
| Total pay out per employee |
|
1.23 |
|
1.35 |
|
1.46 |
| No. of employees |
|
16,617 |
|
16,342 |
|
17,960 |
|
| |
|
|
| |
| Society |
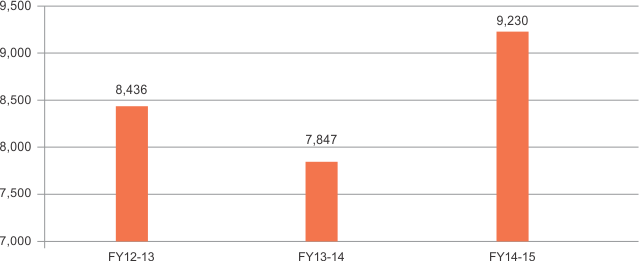
| At the base of our philosophy to give back to society, is our duty to pay all our dues to the government. The amount of tax paid is a direct reflection of the amount of value generated. |
|
| |
|
FY12-13 |
|
FY13-14 |
|
FY14-15 |
| Excise duty |
|
1,348 |
|
1,382 |
|
1,572 |
| Income tax paid |
|
4,990 |
|
5,094 |
|
5,984 |
| Sales tax |
|
1,172 |
|
1,192 |
|
1,307 |
| Dividend tax |
|
433 |
|
520 |
|
694 |
| Total taxes paid |
|
7,943 |
|
8,188 |
|
9,557 |
|
| |
| Total Taxes Paid |
₹ Million |
|
|
| |
| Suppliers |
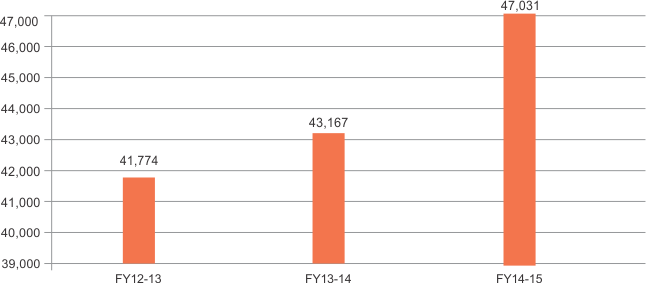
| In the reporting period, as our production increased, so did our expenditure on material and services. |
|
| |
|
FY12-13 |
|
FY13-14 |
|
FY14-15 |
| Material (A) |
|
35,168 |
|
33,171 |
|
37,864 |
| Services |
|
16,429 |
|
NA |
|
NA |
| Total |
|
51,597 |
|
33,171 |
|
37,864 |
| Material % of revenue |
|
30% |
|
25% |
|
25% |
Capital expenditure on property,
plant and equipment (B) |
|
6,606 |
|
9,996 |
|
9,167 |
| Total (A+B) |
|
41,774 |
|
43,167 |
|
47,031 |
|
| |
| Material + Capital Expenditure |
₹ Million |
|
|
| |
| |
|