|
|
| |
| |
| ECONOMIC PERFORMANCE |
| FINANCIALS |
|
|
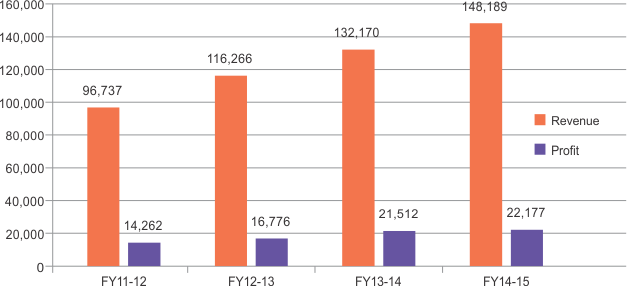
| Economic Value Generated |
Consolidated revenue for FY14 and FY15 was ₹132.17 billion and ₹148.19 billion, a year-on-year growth of 13.7% and 12.1%
respectively. PAT stood at ₹21.5 billion for FY14 and ₹22.18 billion for FY15 registering an increase of 28.2% and 3% over the previous
year respectively. |
| Economic Value Generated |
₹ Million |
|
|
| |
| Revenue - Geographical Mix |
North America continued to garner the largest share of the revenue pie in FY14 and
FY15. What is satisfying is that our revenues from emerging markets registered an
incline in the reporting period as compared to FY13, even in the face of sharp
depreciation of the Russian Rouble. Revenues from India too posted a healthy
year-on-year growth. |
| |
|
|
| 19,198 | 17% |
| |
| 14,162 | 12% |
| |
| 20,262 | 17% |
| |
| 16,908 | 15% |
| |
| 45,736 | 39% |
|
|
|
|
|
| 19,497 | 15% |
| |
| 14,716 | 11% |
| |
| 16,195 | 12% |
| |
| 19,819 | 15% |
| |
| 61,943 | 47% |
|
|
|
| |
|
|
| 21,159 | 14% |
| |
| 20,135 | 14% |
| |
| 17,713 | 12% |
| |
| 18,283 | 12% |
| |
| 70,899 | 48% |
|
|
|
|
|
| |
| Segment Contribution to Revenue |
In FY14 and FY15, revenue from the Global Generics segment increased by 14.6%
and 27.4% respectively. The PSAI business witnessed a dip in revenue in FY14 and
it recovered in FY15. |
| |
|
|
| 1,533 | 1% |
| |
| 1,468 | 1% |
| |
| 30,702 | 27% |
| |
| 82,563 | 71% |
|
|
|
|
|
| 1,250 | 1% |
| |
| 1,783 | 1% |
| |
| 23,974 | 18% |
| |
| 105,164 | 80% |
|
|
|
| |
|
|
| 1,163 | 1% |
| |
| 1,013 | 1% |
| |
| 25,456 | 17% |
| |
| 120,556 | 81% |
|
|
|
|
|
| |
| |
| |
| |
|
|