|
|
| |
| |
| CONTINUOUS IMPROVEMENT |
| CONTINUOUS IMPROVEMENT AT WORK |
|
|
| Machine Productivity |
Machine productivity is defined by its performance to manufacture defect-free desired
products at its maximum validated speed in available time. It is measured through OEE
that is the product of Equipment Availability (Time), Quality of Product and Quantity
Produced. The underlying causes of OEE losses are - unscheduled downtime, speed
loss, extended changeover time, material unavailability, etc. |
| |
 |
| |
| Key initiatives undertaken during the reporting period include: |
| |
Improving Efficiency,
Sustaining Productivity |
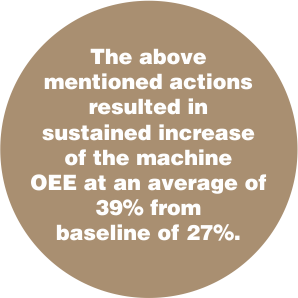
An average OEE (Overall Equipment Effectiveness) of 27% of
Fette tablet press machine in FY14 was impacting timely
deliveries of key products such as Nise tablets & Stamlo 5
tablets. |
In order to enhance the equipment productivity, Team Strikers
(Formulations Baddi Plant 2) identified product-changeover,
startup and speed losses as constraint areas. |
The interventions included:
Deployment of SMED (single minute exchange of die) principle
for reducing changeover cycle time, replacement of normal screw
driver with torque wrench to automate die locking and unlocking,
dedicated vacuum cleaners and implementation of standard work
practices & recipe driven operation. |
Further, implementation of 5S in change parts area for faster
change parts retrieval and gradual increase in RPM of runner
products resulted in reduction of speed losses. |
| |
 |
| |
 |
| |
 |
| |
| |
| |
|
Identifying Constraints,
Implementing Solutions |
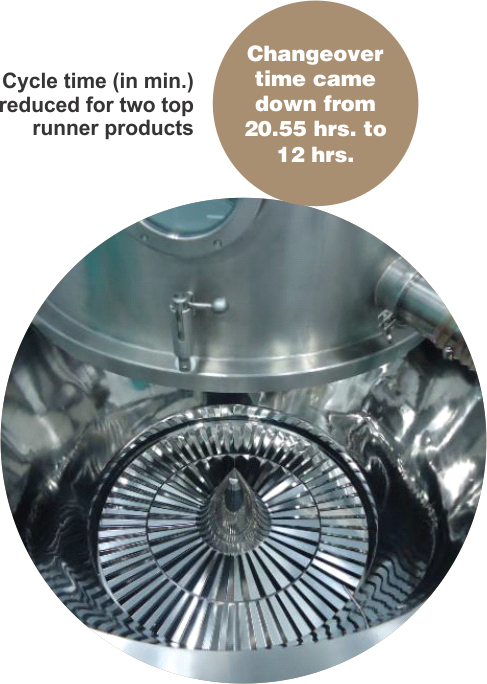
Omeprasole (Omez) 20 mg capsule is one of the top runner
products of Dr. Reddy's in Russia, Romania and Rest of the
World. In FY14, its average monthly output was 55 million units
vis-a-vis the market demand of 75 million. Hence, Omez capsule
was identified for capacity enhancement. |
A project charter was prepared, defining the baseline and target
production capacity, roles and responsibilities, project timeline,
etc. Cycle time of unit operation was measured and analysed
through current state value stream map (VSM), identifying CCR
(capacity constraint resource) of the process. Value stream
mapping is a pictorial tool which maps processes, material &
information flow of a product from start to end. It gives a holistic
view of the process in as-is state and helps narrow down on
areas with scope for improvement. |
| |
 |
| |
The teams Rising Star & Creative Stars of Formulations
Hyderabad Plant 2 identified constraints using Value Stream
Mapping (VSM) & quality control tools. The teams brainstormed
and identified possible reasons for longer cycle time using fish-
bone diagram. Various Lean Six Sigma tools such as VOC
(Voice of customer), CTQ (Critical to quality attributes),
histogram, box plot, scatter plot, Pareto analysis were used
during analysis. |
| |
 |
| Click to enlarge |
| |
The actions thus implemented were:
Process time optimisation, drying efficiency improvement, parallel micronisation & sifting, replacement of existing blender with higher capacity enabling drug mixing & blending as parallel activities, reduction of changeover time from 120 min to 60 min, minimisation of machine setting time, breakdown time reduction of packing machine (ASB bundling & MF 400 machine), improvement in OEE of CCRs and arresting speed losses due to poor quality of packing material. |
| |
Results achieved:
Average output per month has increased to 75 million/month (July to October 14), best demonstrated output is 77 million. This has resulted in approximate savings of ₹20 million through additional business and sea shipment. In order to sustain the benefits, next target of 85 million capsules has been taken for further capacity enhancement. |
| |
| |
|
| |
|
|
| |
|
|